Mayor Adams recently released the Mayor’s Management Report (MMR) for fiscal year 2022 (FY2022), which includes data from the last six months of former Mayor de Blasio’s tenure and the first six months of the Adams’ administration. The report showed that HPD produced 16,042 units, a 43 percent decrease from the previous year. The big decrease was in preservation. To their credit, HPD was able to maintain roughly the same level of new construction of affordable housing while facing staffing challenges.
Taking a closer look at the report, we are highlighting important performance data for HPD, NYCHA and on homelessness.
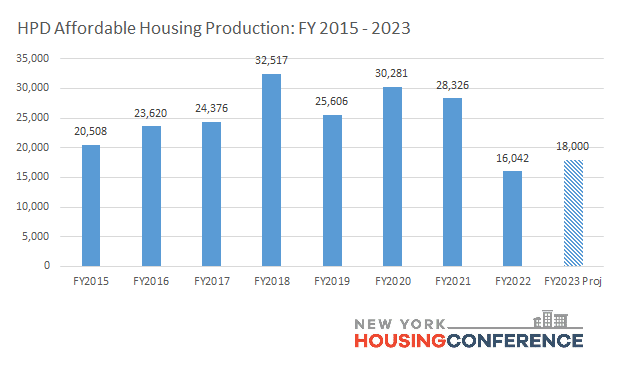
Affordable Housing Spending and Projections HPD’s affordable housing production decreased to just over 16,000 units last year, well below averages of between 25,000 and 30,000 per year under Mayor Bill de Blasio. HPD projects 18,000 units for FY 2023, still below recent production levels. We hope the administration can exceed this target.
The modest target may be due to the ongoing staffing shortage at HPD. Mayor Eric Adams inherited the shortage, but during his first 8 months it has continued to get worse. The agency has lost a net of 4 percent of their staff since Mayor Adams took over, including another 2 percent decrease from May to August. Overall the agency has lost 200 positions since the pandemic started and they have 500 fewer people on staff than they are allowed in their budget.
HPD significantly underspent their capital budget last year – spending just 2/3 of their budget – $915 million out of $1.5 billion. Advocates and the City Council have fought hard for capital budget increases and we cannot afford to let the capital program shrink fewer units of affordable housing produced. Increased staffing is critical to turn this around.
Housing Production Details
The data shows that the city has maintained new construction production at similar levels to recent years under challenging staffing conditions. HPD started 9,625 new construction units compared to an average of around 9,400 per year over the past four years. HPD staff deserve a lot of credit for maintaining this production and adding desperately-needed affordable housing supply.
The 421a program supports roughly ¼ of these units, roughly the same as past years, according to HPD. In other words, the rush to start construction to qualify for 421a before it expired is not driving the HPD affordable construction numbers (421a project starts are counted late in construction).
While new construction starts maintained production, the number of units preserved decreased dramatically – decreasing by 67 percent. There were just 6,417 units preserved in FY 2022, compared to 19,700 on average the past four years. In addition, the city produced just 1,444 homeownership unit starts last year (including new construction and preservation), which is an 86 percent decrease compared to the average over the past four years.

Homeless Housing
The city produced 2,170 units of homeless housing, which is 6 percent less than the average over the past 4 years. While homeless housing starts do not immediately affect the number of people that are unhoused, it will have an effect one or two years down the line meanwhile homelessness is growing in the city.
The number of people in shelter is increasing as evictions are increasing and more migrants are coming to the city. The MMR data also shows that the average length of time in shelter is increasing – with single adults staying 509 days on average, families with children staying 534 days and adult families with no minor children staying 855 days on average. The city desperately needs more housing for people experiencing homelessness.
NYCHA
In FY 2022 NYCHA preserved 5,909 apartments through PACT, more than three times as many units as in FY 2021. NYCHA continues to show strong performance in moving through their PACT pipeline and preserving public housing units.
Very concerning however is NYCHA’s rent collections, down to 66.8 percent, a steep decline from 92.3 percent in FY2018. Decreased rent collections will have serious impacts on their budget and could further impact operations. The average time to resolve emergency repair requests increased to 22 hours, up from 13 hours in 2018 and to resolve nonemergency service requests is up to 49 days, up from 18.6 days in 2018. The average time to turn around a vacant apartment also increased to 164 days, up from 50.8 days in 2018. Finally, just 55.5 percent of capital projects are on schedule, down from 76 percent in 2018.
Last year the state passed legislation to create the Public Housing Trust, with significant advocacy from the Mayor and the team at NYCHA. This should bring more funding for repairs at NYCHA.
New Metrics
The new data released also includes many new people-centered housing metrics that allow for more transparency, delivering on the Administration’s promise to measure how successfully the agency is delivering services. Below are some interesting new data points tracking housing lotteries, move-ins, Section 8 processing and more.
- Percent of new construction in low affordability areas: 9%
- Percent of preservation in low-affordability areas: 10%
- Households approved for a new construction unit through the lottery: 6,173
- Median time to complete applicant approvals for a lottery project: 177 days
- Median time to lease-up a homeless placement set-aside new construction unit: 203 days
- Section 8—Median time from voucher issuance to lease-up: 101 days
Hopefully this new data will incentivize the city to shorten the number of days it takes to approve a lottery project, to lease-up a homeless placement set-aside and to lease up a Section 8 voucher. To their credit, the administration has chosen to track these particular metrics to incentivize improvement.